


Calm Winter Weather
... With Unexpected Effects on Your Health

Hello reader, and welcome to my first blog post. I’m Jess, an engineer-turned-atmospheric scientist who specialises in designing new instruments for atmospheric measurement. One of the main reasons for me writing this blog is to erase some of the esotericism of my field, and give people a bit of insight into what we actually know about climate change, pollution, and the weather, in addition to perhaps reassuring people a little more about what we’re doing about it. Also, while there’s lots of great pop-sci stuff out there for my field, there’s not much in the way of coverage of the actual observations and measurements. This is my first effort at scientific communication so if I fail to explain something, or assume some prior knowledge, that’s on me! You should call me out on this and ask questions if you need to. When I use a code block, I am referring to a statement or piece of information which is utterly opaque and incomprehensible to the average reader, just like programming code is to someone who doesn’t write programming code. Think of this as basically an acknowledgement of agony, which is followed by me frantically doing my best to explain myself. Anyway, on with the blog-post!
Today was a sunny winters day in Manchester – an extremely welcome one after the Atlantic storms – and I can’t stop sneezing and coughing! Whilst it could be a seasonal cold or similar, I know these symptoms and I know what causes them: the atmospheric boogeyman and stark reality of city life – air pollution. More specifically the culprit in this instance is particulate matter pollution, that is, a fine aerosol which penetrates both into your mouth and upper respiratory system, and deep into your lungs (depending on the aerodynamic cross section of a given aerosol particle). In my case it is causing irritation of mucus membranes, but there is also evidence for a whole array of health effects resulting from air pollution. I am not a biologist, and the health effects of pollution are not the point of this post. Rather, my object is to answer the question: why is this happening today?
A Bit of Background (What’s the Weather Like?)
The planetary boundary layer is the thin layer of the atmosphere next to the earths’ surface. The study of a day and night in the lifetime of a planetary boundary layer isn’t new research. We know how it evolves, becomes stable, buoyant, decays into turbulence, and we know the predominant forces which affect these processes. What we have limited knowledge of, is how this interacts with urban development, and the resultant effect on human health. There are a number of reasons for this and some are more obvious than others; I will touch on why this is again at the end.
If I had my paper writing hat on I would state the following: Diurnal variation of a generic boundary layer often consists of an evolution from a stable state to a buoyant state – that is, where local heating or mixing causes hot air to be on the bottom, from which it will rise via convection.But I’m not writing a paper, so lets break that down.
Diurnal variation means the change of a thing during the day, just as nocturnal variation would be the same but at night. When I say stable state boundary layer, I mean a boundary layer where there is hot air on the top and cold air on the bottom, therefore meaning there is no buoyancy within the boundary layer (that is, hot air rising above cold air and causing mixing). Generally speaking there is either hot air on top (nice and stable but also means its a bit cold on the ground), or hot air on the bottom (causes pretty convective clouds, and means its warm on the surface). The latter is an “unstable” or “convective” or “buoyant” boundary layer (unhelpfully these all mean the same thing but are used interchangeably).
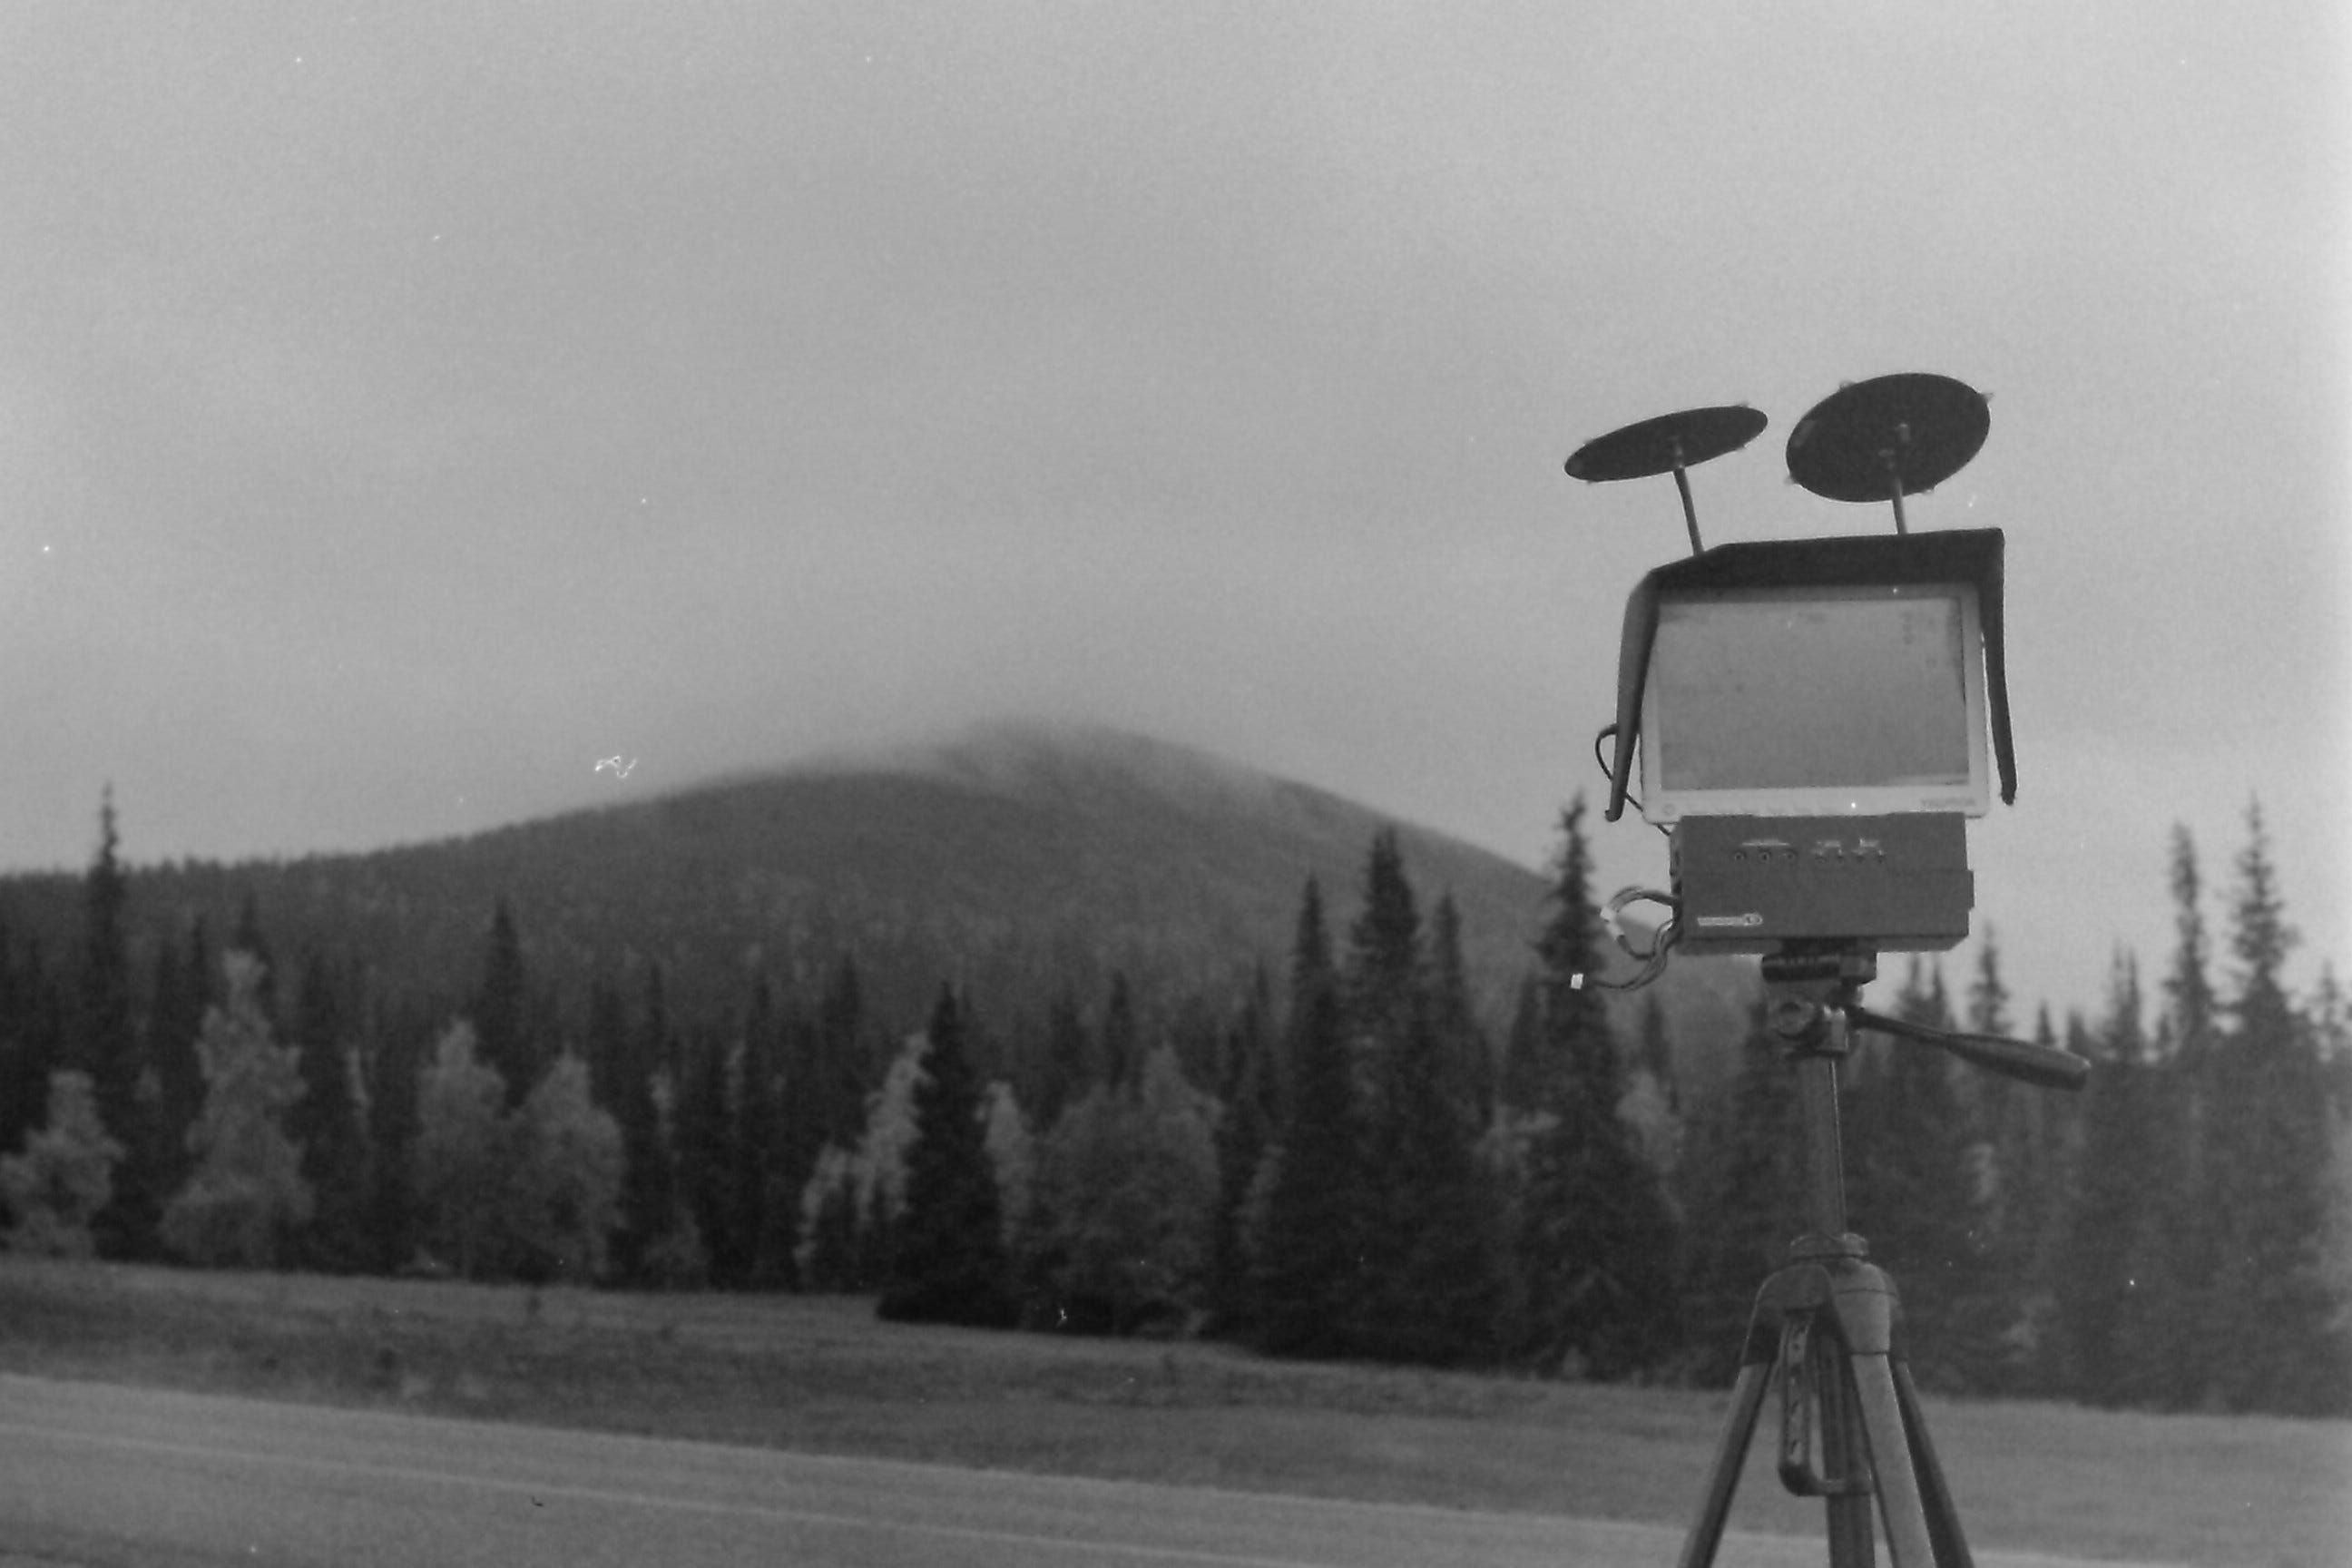
“But Jess”, you might say, “my lecturer told me that the atmosphere gets colder with altitude”. This is basically correct when looking at the atmosphere (or troposphere actually) as a whole, but the boundary layer is special. Eventually there is what we call a temperature inversion, where the air expands because of the dropping pressure, which therefore reduces the temperature of the air*. Essentially there is always a point where the cooling overpowers the heating, and the temperature starts dropping with increasing altitude. Sometimes, you can get cloud in this region, which happens because the temperature lowers below the dew point temperature, which is the temperature a parcel of air with a given amount of water vapor needs to be at in order to start forming a cloud. Figure 1 is an example of such a cloud, which formed in an inversion cap** at just 100m above ground level.
* AN: someone at work pointed out to me that the inversion actually refers to the entire region of the atmosphere where the air is warming with altitude, not the inflection point itself (cf https://glossary.ametsoc.org/wiki/Temperature_inversion).
** AN: I would rephrase this as “at the cap of the inversion”.
I will definitely talk about the formation of different clouds in future posts, since this is absolutely my passion, but it’s beyond the scope of this blog-post. What you need to know is: the presence of this “inversion capping cloud” can actually affect the strength of the inversion itself (it can cool or heat the air beneath it, depending on how large the cloud droplets are). I could talk for a million years about the size of cloud droplets and how that affects everything from local temperature to huge scale climate events, but this post would be an essay.
It’s nice to look at this visually. So let’s look at Figure 2, which is an image of some generic boundary layer changing with time, which I lazily copied from Wikipedia, and put here to illustrate this effect (I did also edit the background so that it works with the black text).

On the x-axis we have time, and on the y-axis we have altitude above the surface level. The exact altitude of the height of the boundary layer is highly variable depending on a wide variety of conditions, and can be anything between 50m to 6km. Explaining some of the jargon in this image:
Convective Mixed Layer – an unstable boundary layer. “Mixed” in this instance can also refer to turbulent mixing of hot and cold air, in addition to the convective stuff I already talked about (this just complicates things, but it’s another mechanism).
Residual Layer – this is the mixed parcel of air that’s left over after once the mixing mechanisms stop working and the cold air ends up at the bottom (usually at night, once convention stops).
Surface Layer – the bit by the surface, under the residual layer. This is the stable cold part at the bottom.
Capping inversion – the inversion at the top of the boundary layer, as mentioned previously.
Cloud layer – clouds! (maybe).
So whats illustrated in Figure 2? Well, it’s just a visual description of the effect I described in the previous paragraphs. There’s a mixed layer which is mixed by some process (usually this is solar heating, but it could also be due to wind), where convection is happening. These form during the day, because this is when the processes which form them – that is, heating from the sun and wind – happen the most during the day. As it turns to night time, the surface cools as the residual layer rises up, and a stable boundary layer is formed. Then it turns to day again, and the process repeats itself. However, what happens when you don’t have a transition into a buoyant, mixed, layer?
On days when there is both very little wind, and very little local heating from the sun – like, for example, those found on today’s clear and bitter winter day – there is no turbulence to mix the boundary layer and only a very slowly accumulating buoyant force from the muted sunlight which will only come into play in the afternoon. These types of boundary layers are common in Northern Europe, where cold Arctic air masses can dominate local weather, but happen with some frequency all around the world. The boundary layer today therefore remained stable throughout the morning and early afternoon.
How Does This Affect my Essential Hot Air Balloon Commute?
If you, like literally tens of others, commute to work via hot air balloon, then you ride the temperature inversion like the waves at Beachy Head. Usually pilots like to sit in this region since it’s quite warm for commuters, and you don’t need much fuel to sustain the altitude here. So if you catch a Balloonber to work, you use this effect to your benefit!
A Measurement Problem.
While we know a lot about the general structure of the boundary layer, in addition to having reasonable understanding of the dynamic processes which are happening at any one moment, its actually a very tricky region to measure properly. Until recently, we haven’t really had the tools and instrumentation to measure many of the parameters we’re interested in here, let alone mount them on aircraft or other moving platforms while ensuring they still measure the correct thing. There is also a broad class of instruments called “atmospheric remote sensing” – basically, this is an instrument which takes a non-intrusive measurement of a parameter remotely. Examples of instruments in this category are weather RADAR, or LIDAR (like radar but with the visible part of the EM spectrum). These remote sensing instruments are often relied upon heavily for measurement, and they also often can’t measure to low enough altitudes to capture the boundary layer.
The boundary layer is also a region of very high spatiotemporal variability and heterogeneity. What I mean by this is the driving force which controls the distribution of any given parameter in the atmosphere is often the same – the movement of air, be it by wind, turbulence, convection, etc. when I say an area is spatiotemporally heterogeneous – which literally means variability in space and time – I basically mean that the air moves a lot, which translates to very sporadic distributions (both in space and time) of lots of different parameters at once. This makes measurement very difficult because it steps up the required resolution significantly.
I am about to talk about relatively new research in atmospheric science, which still has conflicting data and conclusions, since the tools to characterise the effect are quite new. Many of the modern problems in atmospheric physics can be directly linked to forever evolving measurement capability and adherence to international standards.
So What Happened to my Nose?
In basic terms, most of the pollution from local sources (Ozone being the notable exception [3]) remains trapped beneath the temperature inversion cap of the boundary layer [2]. There are some very complex exchange processes which happen at the top of the inversion cap, which govern how much of the boundary layer air (and all it contains) mixes with the rest of the troposphere, but this is beyond the scope of this post. [2] nicely shows how the bulk of the atmospheric pollutants around London are kept within the boundary layer. Here, LIDAR is used, and the measurement mechanism is essentially how much light from a big laser is reflected off the aerosol particles, which is then observed with a telescope. I will probably do a post at some point on light scattering, and how it is related to atmospheric science both as a measurement mechanism and a process which affects solar radiation.
With this [the pollution remaining within the boundary layer] in mind, it follows logically that the lower the boundary layer height, the more concentrated the pollution is… Right? Well this is only half true unfortunately. Many studies, for example [4], noted that the correlation between boundary layer height and pollution concentration is actually fairly weak. This study finds that it’s actually the stability of the boundary layer which affects the concentration of pollutants. This does follow – kind of – logically, since it’s easy to see how mixing a volume of air will equalise the concentrations of pollutants within it, whereas if the air is still, the concentrations will be much higher near the source. Think of it like drinking from a pool of stagnant water versus a well mixed one. There are, however, many studies which suggest that boundary layer height plays a more important role in pollutant concentration [3], but it is very difficult to decouple different processes from each-other in atmospheric science.
It is very difficult to find a boundary layer which is stable and tall, and one which is unstable and short, for example. This is where models and simulations are normally used.
In any case, the cause for my coughing and runny nose today – and other winter days like this – is fairly clear. The stable boundary layer over Manchester this morning was causing an increased concentration of atmospheric pollutants, to the detriment of my sinuses.
Final Thoughts
Air pollution is not only a source problem or a medical problem, but also an atmospheric dynamics problem. This premise is not only limited to boundary layer stability, but also topographical features like those found in the Los Angeles valley, which keeps polluted air entrained within the city (think of stacking up marbles in a box versus free standing).
I would also like the reader to think about how one of the most studied areas of the atmosphere is actually one of the most mysterious in terms of dynamics, particularly when aerosol-radiation interactions – like the one talked about here – are considered. For instance, the papers which I cited here conflict with one another as to whether mixing layer height actually influences pollutant concentration. Aerosols, clouds, and their interactions with radiation are among the hottest topics in atmospheric science at the time of writing, with the IPCC citing them as some of the leading causes in uncertainty for climate change in particular since 2007 and continuing on into the present day (cf IPCC Action Reports 4-6). It’s clear that this is not only limited to climate change, but also weather prediction, air pollution studies, and atmospheric science generally.
References
[1] By NikNaks - Own work based on: http://ars.sciencedirect.com/content/image/1-s2.0-S0360128504000371-gr4.jpg.See also: http://www.archaeocosmology.org/eng/tropospherelayers.htm., CC BY-SA 3.0, https://commons.wikimedia.org/w/index.php?curid=18862904, image obtained from Wikipedia on 2024/01/09, https://en.wikipedia.org/wiki/Planetary_boundary_layer#/media/File:Atmospheric_boundary_layer.svg.
[2] Simone Kotthaus, Christos H. Halios, Janet F. Barlow, C.S.B. Grimmond, Volume for pollution dispersion: London's atmospheric boundary layer during ClearfLo observed with two ground-based lidar types, Atmospheric Environment, Volume 190, 2018, Pages 401-414, ISSN 1352-2310, https://doi.org/10.1016/j.atmosenv.2018.06.042.
[3] Yuval, Yoav Levi, Uri Dayan, Ilan Levy, David M. Broday, On the association between characteristics of the atmospheric boundary layer and air pollution concentrations, Atmospheric Research, Volume 231, 2020, 104675, ISSN 0169-8095, https://doi.org/10.1016/j.atmosres.2019.104675.
[4] Tang, G., Zhang, J., Zhu, X., Song, T., Münkel, C., Hu, B., Schäfer, K., Liu, Z., Zhang, J., Wang, L., Xin, J., Suppan, P., and Wang, Y.: Mixing layer height and its implications for air pollution over Beijing, China, Atmos. Chem. Phys., 16, 2459–2475, https://doi.org/10.5194/acp-16-2459-2016, 2016.